This article reviews the architecture of cloud-based visualization of the data from ESP32 microcontroller. My experience may help other developers/architects avoid the problems I encountered during the development process. It contains the links to source code, HOWTOs locally and in AWS and lessons learnt.
Links used in the project
- Terraform provision configs
- Server configs & appps
- ESP32 flashware
- Udemy. IoT Application Development with ESP32
- How to Set Up a Mosquitto MQTT Broker Securely
in Summer 2024 I finished one after another trainings, namely IoT Application Development with ESP32 from Udemy and “Deploying Serverless Application on AWS with Terraform” provided by my former employer.
Have you had a feeling after passing a training “hm, that was good but I want to practice it!”. At least I had one. So I decided make a project where I can leverage the new knowledge. I set two simple goals:
- visualize the data from ESP32 as time series, namely temperature, humidity, RSSI level.
- add it to EPS32 embedded web-server and make it as WEB service the cloud.
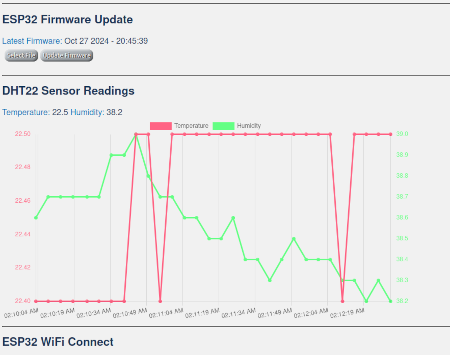
Visualization in ESP32 embedded web-server
No issues were there. I extended original IoT course’s repository by adding chart.js library and sensor chart to embedded ESP32 web-server. My fork with extensions and detailed description is located here.
WEB service visualization on AWS. Initial Software Architecture
The idea was to deploy Grafana as UI on EC2, add AWS IoT Thing as MQTT Broker, use DynamoDB as data storage, set up API Gateway for accessing data over HTTP and add few lambdas to glue things together.
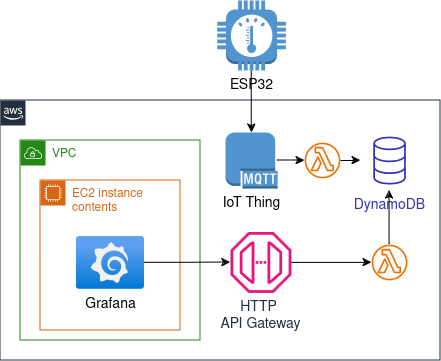
At that moment I didn’t really study Grafana and its data sources and naively thinking that it supports data fetching from REST API or DynamoDB out of box.
Revised Software Architecture: Attempt Two
During the development I decided to simplify design by moving from lambdas and instead use a python script for forwarding MQTT messages to DynamoDB and use DynamoDB data source in Grafana for fetching time series data. A part from that I replaced AWS IoT MQTT Broker by Eclipse Mosquitto MQTT Broker which I installed on the same EC2 instance where Grafana was. Route53 is used to have a static hostname for ESP32.
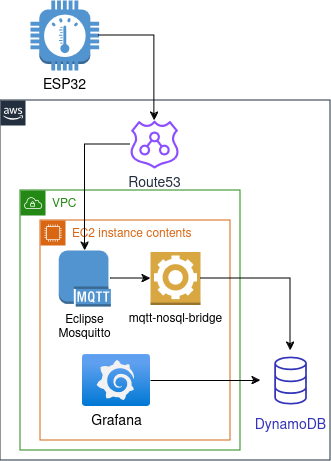
At the stage when I tried to connect Grafana and DynamoDB I realized that the current architecture would require additional expenses. I avoided it and come up with the final architecture design (down below).
Anyways I decided to upload this implementation partially finished (with no Grafana connection). Even more, there are 2 configurations of MQTT communications on the server side, namely using user/pass authentication and using communication over TLS. Pay attention: SoC flashware is configured for TLS communication only.
Final Software Architecture
Only at that point I started to study Grafana and its data sources. It seemed that Prometheus together with Prometheus Pushagateway was most common choice for collecting time series data over REST.
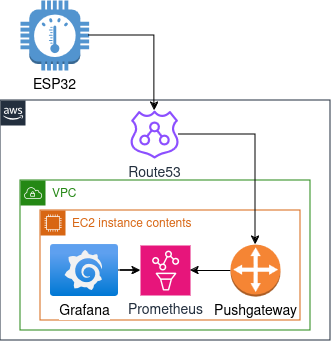
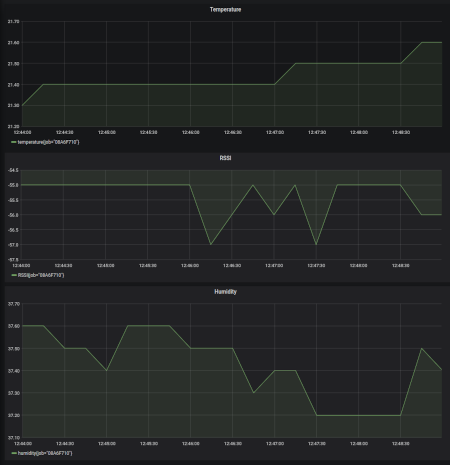
Here are the links to the final architecture: Terraform config, SoC flashware and Grafana config (is deployed by Terraform). The final solution is not focused on security aspects. This one is left on the used user.
Lessons Learnt
After going over 3 architecture iterations, I summarize the outcome in 2 points:
- The simpler the architecture, the better. I went down from 7 elements to 5 at the final stage.
- Get to know all the components and the interfaces between them in your architecture. I would safe a lot of time avoiding useless implementation if I’d study Grafana beforehand.
How to reproduce
Flash ESP32
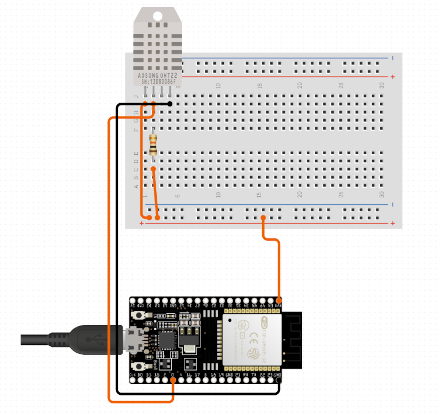
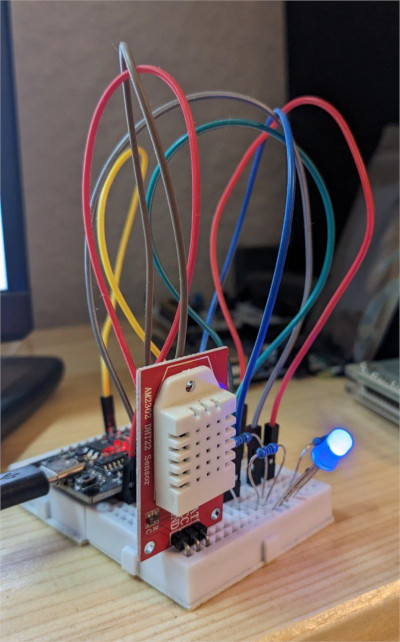
- assemble ESP32 with a DHT22 sensor, according to wiring diagram
- clone the course’s repo with my extenstions
- read the READE.md and adapt the code to your needs
- build and flash to your hardware
AWS deployment of server side
- clone Terraform configs repo
- read the READE.md
- adapt techrecords_grafana.tfvars to your needs
cd esp-data-collection-tf/prometheus-grafana/
terraform apply  -var-file=techrecords_grafana.tfvars
Grafana should be accessible over the port 3000 and EC2 IP (or your subdomain name from “techrecords_grafana.tfvars”)
Local deployment of server side (tested on Ubuntu 22.04)
- invoke following commands:
git clone https://github.com/bespsm/esp-data-collection-srv.git cd esp-data-collection-srv docker compose up -d - go to grafana local page
This post is auto generated from the repository: https://github.com/bespsm/techrecords-org.git
If you find a mistake in this article, please use Contact page.
